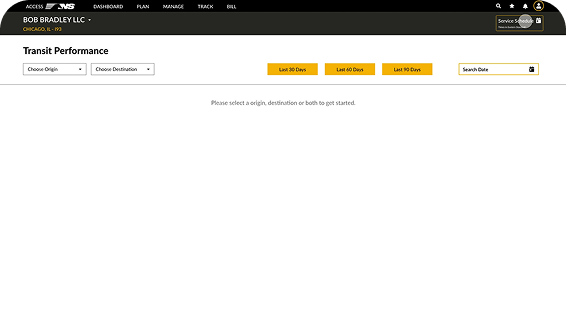
Market research
Compared real-time tracking, predictive analytics, transparency, and notifications.

 Rail operations · Product design
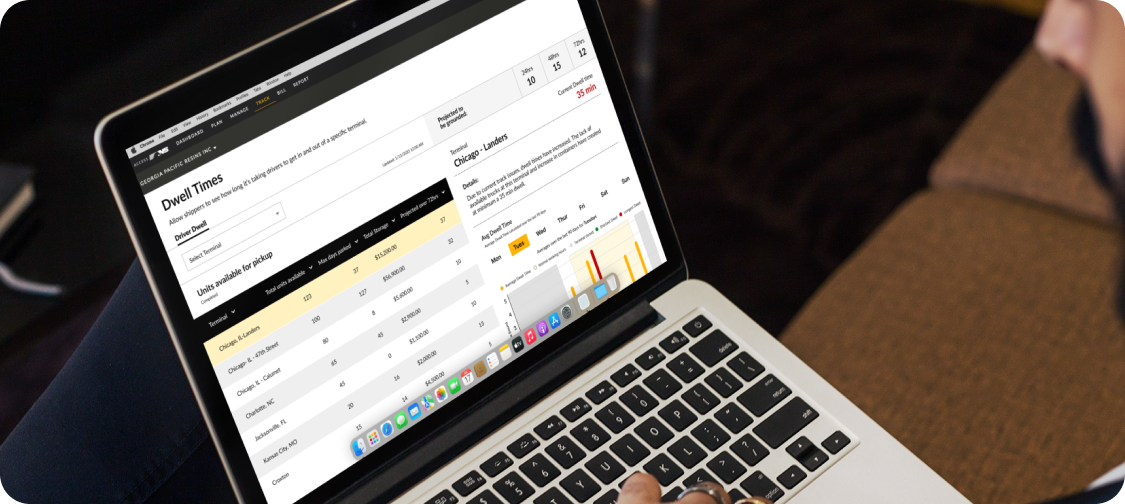
I led UX/product design for Transit Performance within Norfolk Southern’s NS Suite, helping customers compare routes and plan more reliable shipments. I worked across research, journey mapping, data visualization, and responsive design to turn dense rail data into clearer operational decisions.
Problem
The platform had to integrate real-time data from multiple sources while remaining understandable to experienced and novice users.
Approach · Market research

Proactive shipment monitoring and exception alerts demonstrated the value of early communication.

Clear tracking and delivery controls showed how users can act on information, not simply view it.

Transparent milestones reinforced the importance of consistent status language.
Real-time updates enable proactive decisions.
Data transparency strengthens customer trust.
Predictive signals help teams prevent delays.
Approach · User interviews
Across roles, participants prioritized real-time tracking, accessible on-time performance metrics, simpler reporting, and the ability to work across desktop and mobile.

“Real-time shipment visibility is essential for preventing delays.”

“I need performance signals that are easy to compare across routes.”

“Dense reports slow down decisions when an exception needs attention.”

“Proactive updates help us communicate before a service issue escalates.”

“The same information needs to work in the office and while I am mobile.”
Surface exceptions before they grow.
Make performance comparable across lanes.
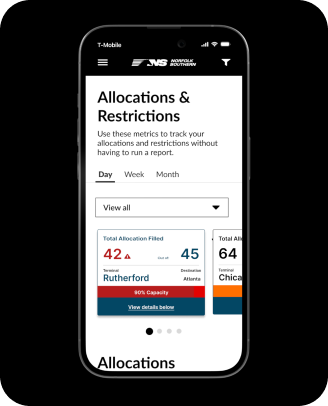
Make the same information available on desktop and mobile.
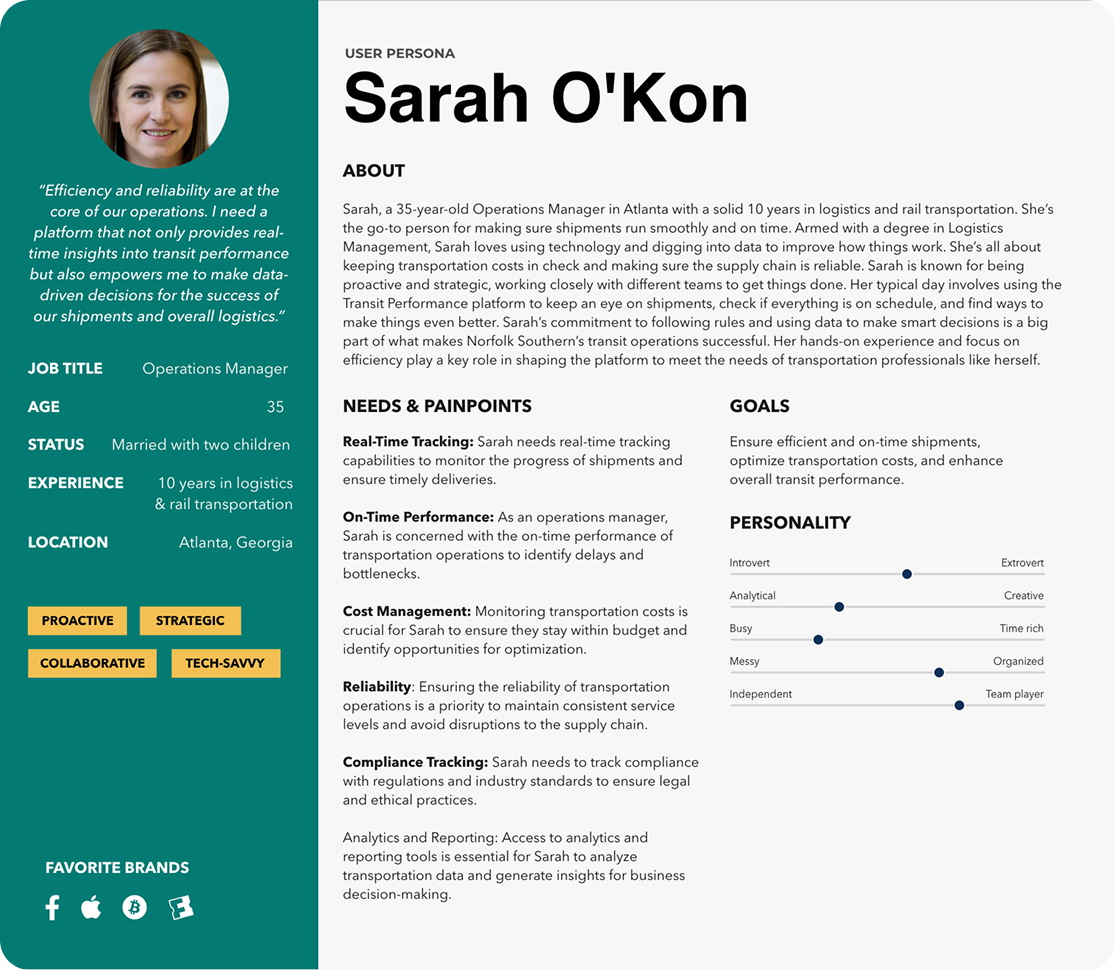
Approach · User persona
Sarah is an operations manager responsible for reliable shipments, cost control, and on-time performance. She needs real-time tracking, compliance visibility, analytics, and trustworthy reporting to make quick decisions.
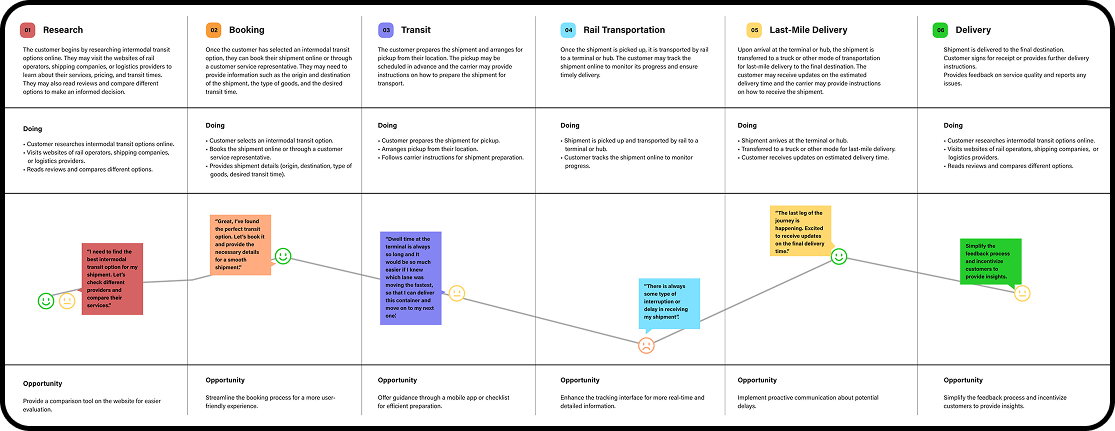
Approach · User journey
The journey revealed opportunities to improve comparison during research, streamline booking, clarify terminal dwell, deliver real-time rail updates, and communicate potential last-mile delays.
Solution
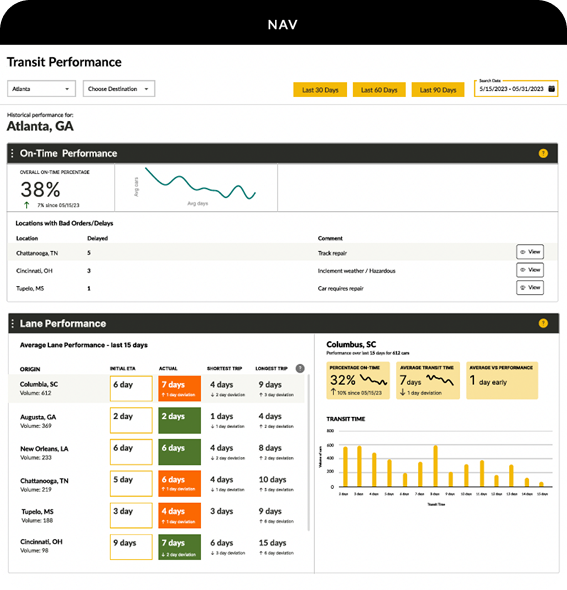
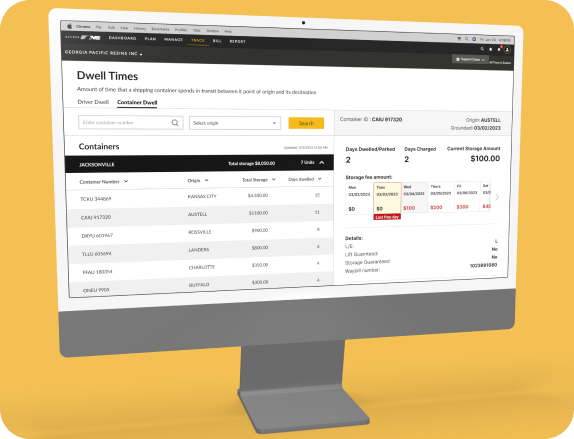
The new experience combines on-time performance, dwell time, empty fill rate, historical trends, forecasts, role-based views, filters, and automatic notifications in one responsive platform.
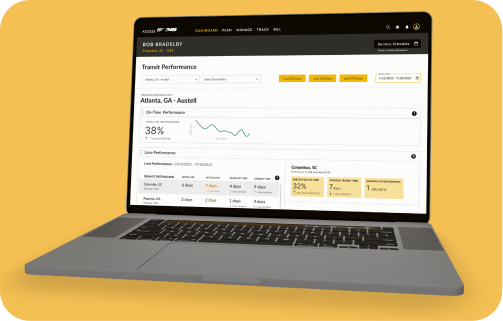
On-time performance, dwell time, and filters help teams compare routes and spot problems.
Comparative measures help users benchmark lanes and identify opportunities.
Consistent charts and labels help people use the same information in the office and on the go.